
Wednesday, August 26, 2026

India's 100 new coal facilities face $150B stranded asset risk as renewables undercut fossil fuel economics

India's Ministry of Coal is pushing forward with 100 new coal facilities despite catastrophic stranded asset warnings from energy analysts. The infrastructure buildout locks billions into assets that may become economically unviable before their planned lifespan ends, as solar and wind costs continue falling below coal generation expenses.

India's 100 new coal facilities face $150B stranded asset risk as renewables undercut fossil fuel economics
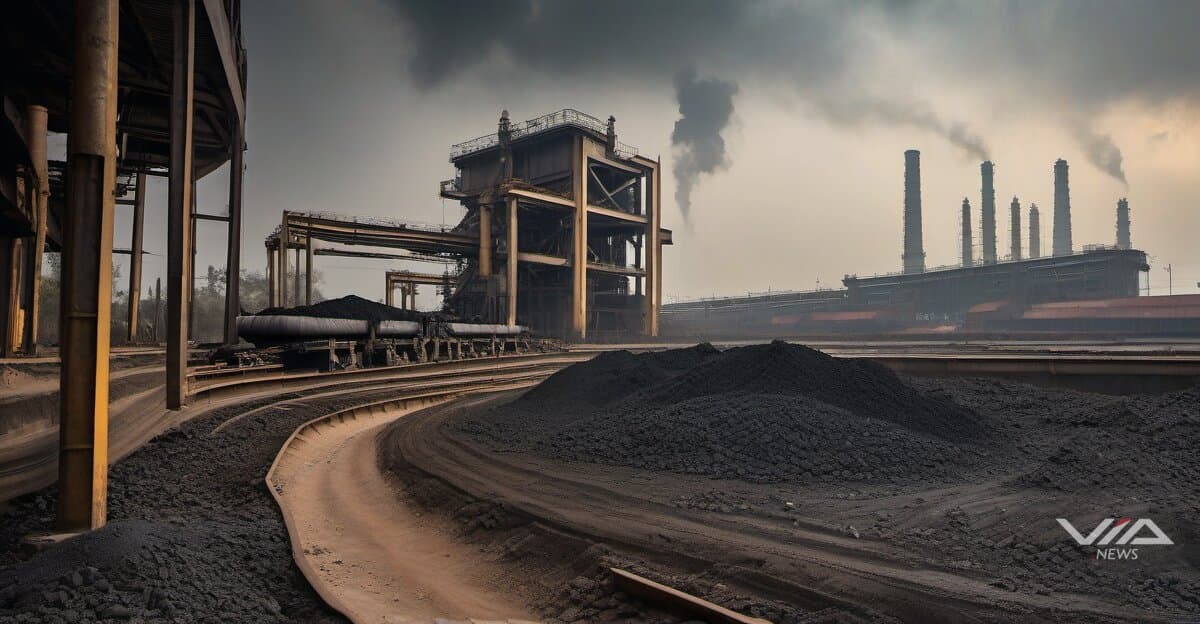
Image generated by AI for illustrative purposes. Not actual footage or photography from the reported events.
Loading stream...

India is constructing 100 new coal facilities even as energy economists flag a high probability of stranded asset losses reaching $150 billion or more. The Ministry of Coal's expansion plan creates long-term capital exposure to infrastructure that could lose economic viability within 10-15 years.

Renewable energy costs have dropped 89% for solar and 70% for wind since 2010, according to IRENA data. Coal plants require 25-40 year operational lifespans to recover capital costs, but the economics are shifting faster than the depreciation schedules.

The stranded asset risk stems from three converging factors: falling renewable costs, rising carbon pricing mechanisms, and declining capacity utilization. Coal plants in India already run at 55-60% capacity factor, well below the 75-80% needed for profitability.

Financial institutions are beginning to price in the risk. The Reserve Bank of India issued guidance in 2023 on climate-related financial risks, specifically flagging coal infrastructure exposure. International lenders have pulled back from coal financing, leaving domestic banks holding concentrated risk.

The Ministry's "Atmanirbhar" self-reliance strategy prioritizes domestic coal production to reduce import dependency. India imported 248 million tonnes of coal in 2024 at a cost of $32 billion, creating the policy rationale for new facilities.

However, the commodity market implications extend beyond coal itself. Stranded assets would ripple through mining equipment manufacturers, rail transportation networks, and thermal power plant operators. The National Thermal Power Corporation holds $45 billion in coal-fired assets on its balance sheet.

Market analysts point to Germany's coal exit as a precedent. Germany wrote down €30 billion in coal assets between 2015-2025, with utilities like RWE and Uniper taking massive impairments. India's exposure is potentially five times larger given the scale of new construction.

The timing creates a commodity market paradox: short-term coal demand remains strong as India's power consumption grows 6% annually, while long-term asset values face structural decline. Investors in Indian energy infrastructure face a narrowing window to recover capital before the transition economics shift decisively against fossil fuels.

In this story · Knowledge Files

What we know · the intelligence behind this page
Live from the substrate
What we're seeing
AI Leadership Exodus Rattles Investor Confidence Amid Capex Boom
High-profile departures at top AI labs — Brad Lightcap's exit from OpenAI and an unnamed researcher's departure from Alphabet/Google that triggered a share-price drop — are surfacing talent retention as a market risk factor even as hyperscalers pour record capital into AI infrastructure. The reaction shows investors treating key-person risk at frontier AI labs as material to valuation, a new fragility layered onto an otherwise bullish AI-driven capex cycle.
Our read on the data ›
Signals we're tracking
EPKINLY Regulatory-Clinical Success Cascade
High probability of expanded label indications, additional combination approvals, and competitive positioning strength in follicular lymphoma market. Predicts positive commercial uptake and potential accelerated review for related indications.
Patterns we're watching ›
Where sources disagree
Broadcom Inc.
Both facts report EPS for Broadcom Inc. for the same fiscal period (Q1 2026) observed on the same date (2026-02-01). However, they report conflicting values: 1.5 USD per share vs 2.05 USD per share. This is a 37% difference for the identical metric and time period, not a value change over time.
We flag conflicts openly ›
Recently verified
Checked against the original source
4,978
facts traced to their source — and we flag the ones that don't hold up.
101 entities tracked4,978 facts checked against source5,251 source documents archived
Query this data → isubstrate.com