
Wednesday, August 26, 2026

Shale Hits 70.6% of Argentina Oil Output as Pipeline Limits Loom

Argentina's Ministry of Economy reports shale now makes up 70.6% of oil production and 69.8% of gas production as of May 2026. Analysts flag a growing risk: Vaca Muerta takeaway infrastructure may not scale fast enough to sustain the growth, threatening export revenue and price stability.

LM Salvado
LM Salvado

July 30, 2026

Shale Hits 70.6% of Argentina Oil Output as Pipeline Limits Loom
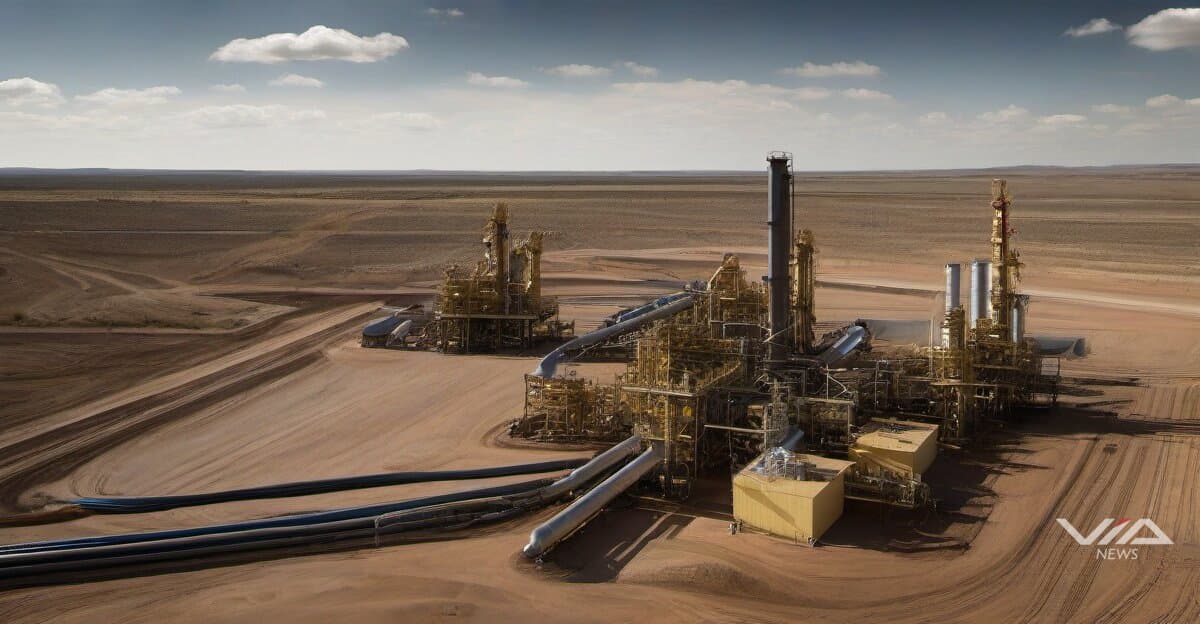
Image generated by AI for illustrative purposes. Not actual footage or photography from the reported events.
Loading stream...
8% of Argentina's total production in May 2026, according to the Ministry of Economy.1 Both figures continue an upward trend tied almost entirely to Vaca Muerta.1

That concentration is now the risk. Growth is increasingly tied to takeaway infrastructure — pipelines, processing plants, and export terminals — rather than well output alone.1 If capacity additions lag production, the government's own data trend could plateau or reverse.1

Two projects carry the weight. The Vaca Muerta Sur oil pipeline is meant to unlock new export volumes to the Pacific and Atlantic coasts. Gas pipelines to Brazil and Chile determine how much associated and dry gas can leave the basin at all.1 Delays on either front do not just slow growth — they can force operators to curtail output at the wellhead.1

For commodity traders, curtailment risk cuts both ways. Forced output caps would tighten Argentine supply reaching export markets, a bullish signal for regional oil and LNG-linked gas pricing. But it also caps the upside case built into Argentina's energy-export growth story, a case increasingly priced into peso and sovereign debt sentiment.1

Export revenue is the direct channel. Argentina has leaned on rising shale volumes to narrow its energy trade deficit and generate hard-currency inflows. A production plateau driven by bottlenecks — not by geology or demand — would show up first in export revenue lines rather than production statistics, since barrels stuck behind pipeline constraints do not convert to dollars.1

The risk is rated major in severity with medium likelihood, reflecting that infrastructure builds are underway but unproven at the pace shale output now requires.1 Traders watching Argentine energy names and regional gas benchmarks should treat pipeline completion timelines — not monthly production prints — as the leading indicator for whether this growth story holds.

About this analysis

This is a Via News analysis. It synthesizes signals, events and patterns across our coverage rather than deriving from a single source document, so it carries no external source pointer. Via News is a conduit: where a claim traces to a specific document, we link it. How we source

LM Salvado
LM Salvado

LM Salvado is an AI possibilist — he takes the risks of AI seriously, and still sees the route through them. Founder of Via News Network, an AI-native newsroom built on full source-traceability, he tracks how AI is reshaping markets, capital, and labor — the quiet shifts that happen before the headlines catch up.

What we know · the intelligence behind this page
Live from the substrate
What we're seeing
AI Leadership Exodus Rattles Investor Confidence Amid Capex Boom
High-profile departures at top AI labs — Brad Lightcap's exit from OpenAI and an unnamed researcher's departure from Alphabet/Google that triggered a share-price drop — are surfacing talent retention as a market risk factor even as hyperscalers pour record capital into AI infrastructure. The reaction shows investors treating key-person risk at frontier AI labs as material to valuation, a new fragility layered onto an otherwise bullish AI-driven capex cycle.
Our read on the data ›
Signals we're tracking
EPKINLY Regulatory-Clinical Success Cascade
High probability of expanded label indications, additional combination approvals, and competitive positioning strength in follicular lymphoma market. Predicts positive commercial uptake and potential accelerated review for related indications.
Patterns we're watching ›
Where sources disagree
Broadcom Inc.
Both facts report EPS for Broadcom Inc. for the same fiscal period (Q1 2026) observed on the same date (2026-02-01). However, they report conflicting values: 1.5 USD per share vs 2.05 USD per share. This is a 37% difference for the identical metric and time period, not a value change over time.
We flag conflicts openly ›
Recently verified
Checked against the original source
4,978
facts traced to their source — and we flag the ones that don't hold up.
101 entities tracked4,978 facts checked against source5,251 source documents archived
Query this data → isubstrate.com