
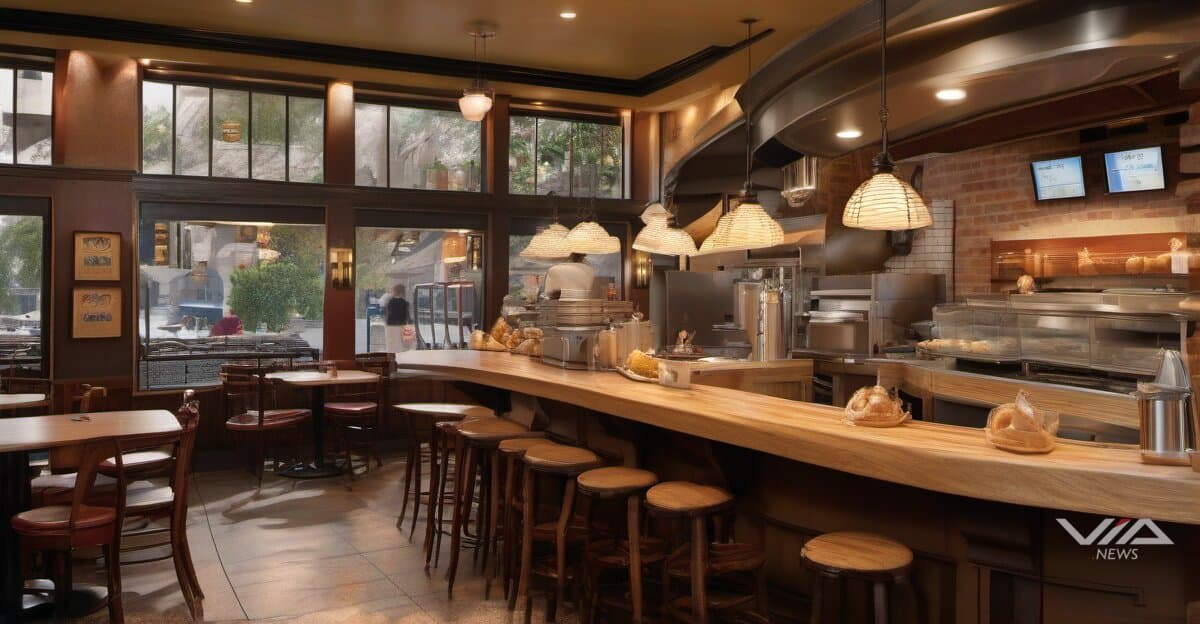
Chi-Chi's brand revival operates from one Minnesota restaurant, concentrating all comeback risk in a single location after the chain's 2004 collapse eliminated its 200+ U.S. footprint.
The operational structure creates catastrophic exposure. Revenue, brand reputation, and expansion viability hinge on one site's performance with zero backup locations if execution fails. No geographic diversification exists to offset local market challenges or operational setbacks.
This contrasts sharply with typical restaurant revival strategies. Comparable brand resurrections typically launch 3-5 pilot locations across different markets to test concepts and spread risk. Chi-Chi's chose the opposite approach.
The risk assessment carries medium likelihood with 70% confidence, reflecting real probability of failure modes. Equipment breakdowns, staffing crises, local competition, or execution missteps at the solo location would halt the entire revival. No sister restaurants exist to maintain momentum or cash flow during disruptions.
Market context amplifies stakes. Casual dining faces 8-12% same-store sales pressure industry-wide in 2026. Mexican restaurant concepts compete in an oversaturated segment with established players holding dominant market share. Chi-Chi's must overcome both industry headwinds and two decades of brand absence.
The single-location model also constrains investor visibility. Traditional multi-unit rollouts generate comparative data across markets, revealing which elements work. Chi-Chi's provides one data point, making it impossible to separate location-specific factors from brand viability signals.
Financial exposure scales with the concentration. Franchise partners or equity investors backing the comeback place capital behind unproven unit economics at a single address. Supply chain arrangements, marketing spend, and operational infrastructure built for one restaurant create fixed costs without revenue diversification.
Geographic risk compounds operational concentration. Minnesota market conditions—weather patterns, local economic performance, regional taste preferences—dictate outcomes for the entire brand. A harsh winter or local recession impacts 100% of operations, not a percentage of a multi-unit portfolio.
The revival's success metrics remain binary: the Minnesota location either validates expansion or confirms the brand cannot compete in modern casual dining. No middle ground exists when operating a single restaurant.