
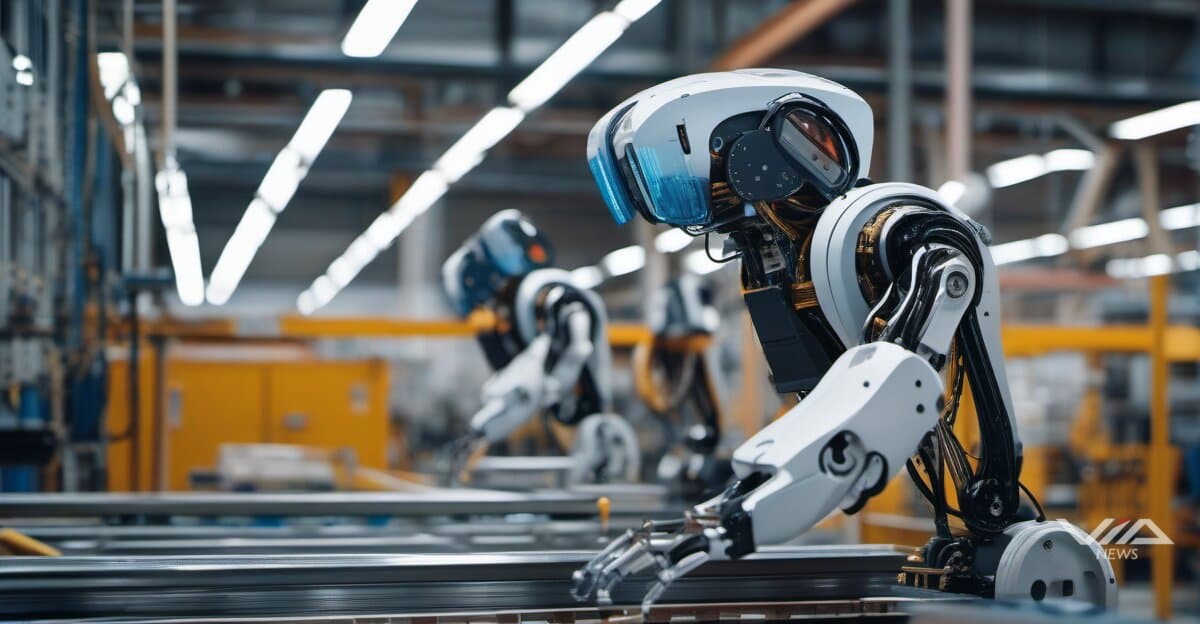
The Americas recorded more than 55,000 industrial robot installations for the third consecutive year, sustaining momentum in manufacturing automation. UK installations jumped 51% in September 2024, signaling accelerating adoption beyond traditional automation hubs.
Battery technology partnerships are emerging as key drivers for mobile robot expansion. Hyundai, Kia, and Samsung SDI formed a collaboration to develop battery systems for industrial robotics. Electrovaya plans to launch a dedicated robot battery system on July 1, 2025, targeting extended runtime and fast charging for warehouse and factory environments.
A comprehensive Industrial Robot Battery Market Report released January 28, 2026, outlines specifications and deployment metrics for battery-powered autonomous systems. Mobile robots—including AMRs and AGVs—require energy solutions that balance weight, cycle life, and charging infrastructure costs.
For industrial equipment manufacturers, sustained installation volumes above 55,000 units validate long-term capex commitments. Robotics suppliers integrating battery technology early gain positioning in mobile automation segments, where uptime and energy efficiency directly impact ROI calculations.
The UK's 51% installation growth reflects post-pandemic manufacturing reshoring and labor cost pressures. European manufacturers are deploying collaborative robots and mobile platforms to address workforce gaps, creating demand for lighter, longer-lasting battery systems.
Investors should track quarterly installation data across regions in 2026 to measure whether the 55,000-unit floor holds. Correlation between battery partnerships and mobile robot deployments will clarify whether energy storage becomes a differentiator or commoditized input.
Battery system specifications in new robot launches—charging time, cycle count, energy density—will signal whether mobile platforms can match fixed-install robots in total cost of ownership. Electrovaya's July launch and Samsung SDI's partnership roadmap offer near-term data points.
Industrial automation stocks with battery integration capabilities or partnerships may benefit from mobile robot adoption trends. Equipment makers lacking energy storage solutions face integration costs and longer development cycles.