
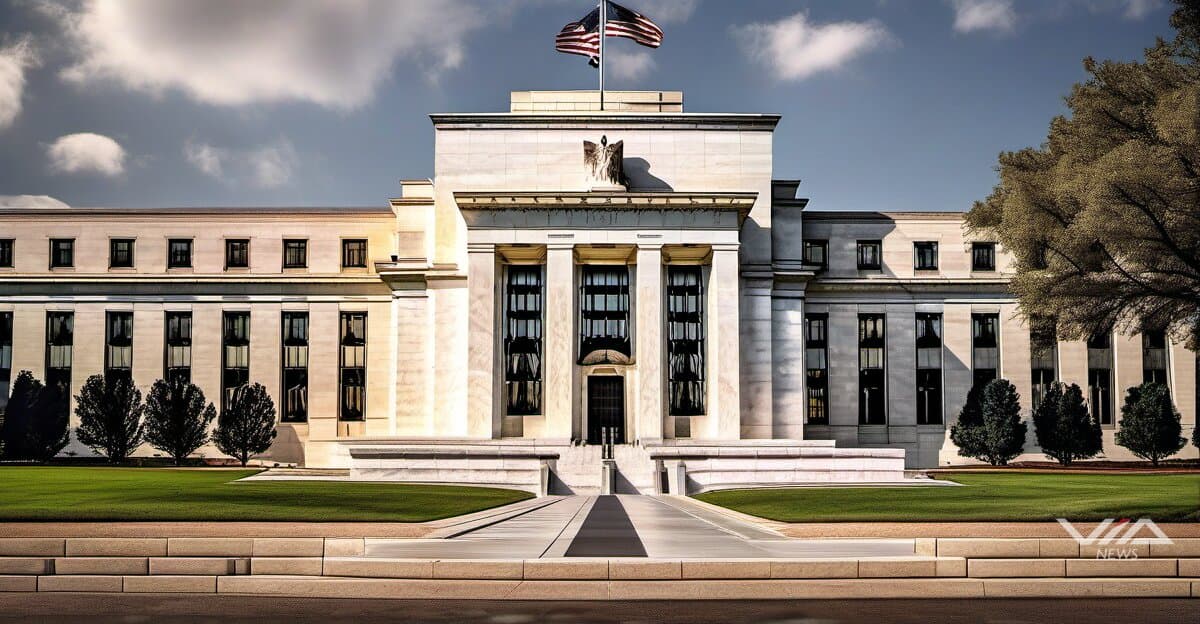
The Federal Reserve's monetary easing cycle initiated in September 2025 will likely remain on hold through Q2 2026, according to Fed official Austan Goolsbee and market strategists tracking persistent services inflation.
Core services inflation excluding housing has stabilized above 3.5% annualized, preventing additional rate cuts despite market expectations for looser policy. Geoffrey Kendrick at Standard Chartered places odds of a Fed rate cut before May 2026 below 1%, citing inflation durability in wage-sensitive sectors.
Rate-sensitive equity sectors face mounting pressure under the prolonged pause scenario. REITs and utility stocks, which collectively represent $1.8 trillion in market capitalization, have historically underperformed during rate-hold periods as their dividend yields lose appeal against risk-free rates. Growth technology stocks carrying high price-to-earnings multiples face valuation compression as the discount rate remains elevated.
The Bank of Canada identified highly indebted households as a critical vulnerability, with rising rates increasing default risk across North American credit markets. This dynamic extends to corporate borrowers in cyclical sectors, where refinancing costs at current rates exceed original debt servicing by 200-300 basis points.
Cryptocurrency markets show acute sensitivity to the rate outlook. Bitcoin ETF investors hold positions with average losses exceeding 20% from peak 2025 valuations. Kendrick projects further capitulation in crypto ETF flows as the opportunity cost of holding non-yielding digital assets increases relative to money market funds paying 4.5-5%.
Trading opportunities emerge in this environment. Short positions in high-duration growth stocks offer asymmetric risk-reward as multiple compression accelerates. Value stocks in energy and financials provide inflation hedges with positive carry from dividends. Investment-grade corporate bonds in the 3-5 year maturity range capture yield without excessive duration risk.
The key monitoring points through June 2026 include FOMC statement language shifts, monthly core services CPI prints, and performance dispersion between growth and value equity factors. A confirmed Fed pause with services inflation above 3.5% validates bearish positioning in rate-sensitive assets while favoring short-duration income strategies.