
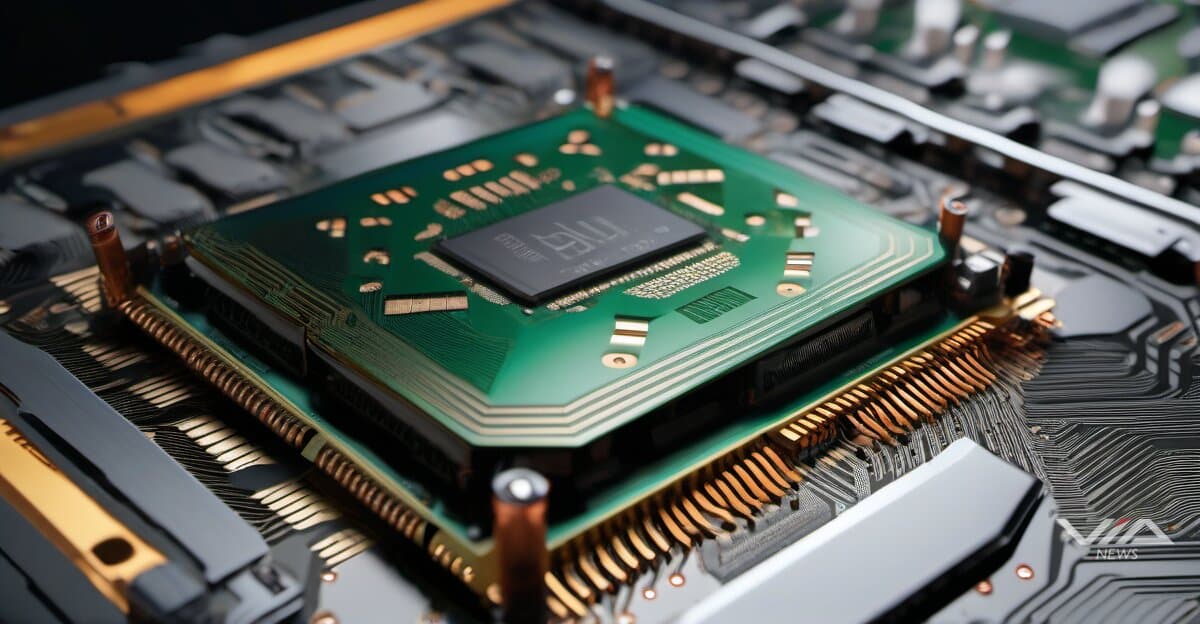
Anthropic committed to 1 million Trainium2 chips from Amazon Web Services, marking one of the largest custom AI accelerator deployments on record. The order coincides with Amazon's Project Rainier data center unveiling and follows the company's Q3 2025 earnings beat.
Google launched Ironwood, its seventh-generation Tensor Processing Unit, as Alphabet reported stronger-than-expected Q3 2025 results. The TPU advancement continues Google's strategy of purpose-built silicon for machine learning workloads rather than relying on general-purpose GPUs.
Custom accelerators from cloud providers now compete directly with NVIDIA's GPU monopoly in AI training and inference. Hyperscalers face mounting pressure to reduce per-query costs as AI services scale, making chip economics central to competitive positioning.
The Trainium2 deployment suggests AWS clients prioritize cost optimization over GPU flexibility. Amazon's vertical integration—from chip design through data center infrastructure—enables pricing advantages that third-party GPU suppliers cannot match.
Market analysts project custom AI chips could capture 20-30% of cloud AI workload share by end-2026, up from an estimated 12% in 2025. The shift depends on whether specialized accelerators deliver superior cost-per-inference metrics versus NVIDIA's H100 and upcoming B200 GPUs.
Google's TPU roadmap targets inference workloads where fixed algorithms allow extreme optimization. Amazon's Trainium focuses on training efficiency for large language models, creating parallel competitive threats to NVIDIA's market segments.
Semiconductor sector valuations may reprice as GPU revenue concentration decreases. NVIDIA shares trade at premium multiples assuming sustained AI infrastructure dominance, but diversified chip demand could compress margins and redirect capital toward custom silicon developers.
The hypothesis faces testing in 2026 as deployment volumes, published cost-per-inference benchmarks, and cloud provider market share data emerge. If custom chips prove economically superior, expect accelerated hyperscaler R&D spending and potential acquisition activity targeting AI accelerator startups.
Investors should monitor AWS and Google Cloud AI service pricing, chip deployment announcements, and NVIDIA's data center revenue growth rates for early signals of market share redistribution.